Feedlot trends in management and productivity
Posted on December 5, 2023 by Derrell Peel
Source: Farm Progress. The original article is posted here.

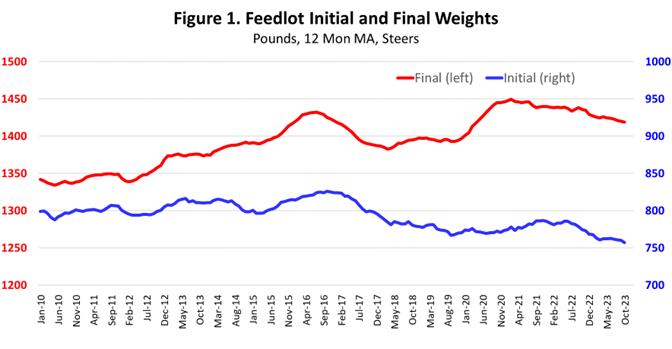
Feedlot production continues to develop and reflect changes in cattle genetics and feeding technology and management. This article summarizes trends in production and productivity in Kansas feedlots over the last 15 years. The data is from the Focus on Feedlots survey compiled by Kansas State University. Figures 1-6 depict data as twelve-month moving averages, which smooths month-to-month and seasonal variation to focus on underlying trends. This article focuses on steers but data on heifers indicates similar trends over time.
Figure 1 shows how feedlot placement and finishing weights have changed over time. Average final weights the last twelve months have been 1419 pounds, up 80 pounds from the average final weight in 2010. Average initial weights have been lower in recent years, averaging 757 pounds the last year, and down by 43 pounds from the 2010 level. Both initial and final weights are impacted by cyclical variation in cattle numbers and by feed costs.
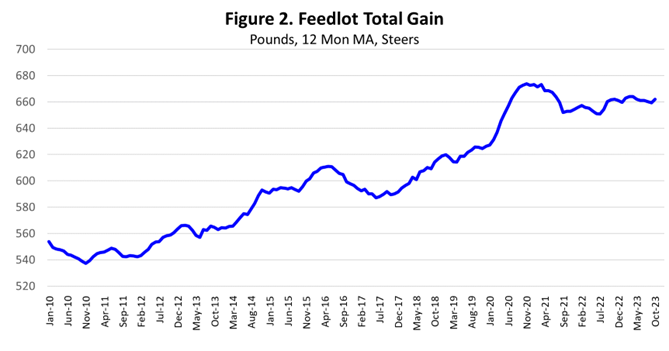
The gap between initial and final weights means that the amount of cattle gain occurring at the feedlot has increased over time. Figure 2 shows the increasing amount of total feedlot gain over time. Total feedlot gain currently averages 123 pounds more than in 2010. About two-thirds of the increase in total feedlot gain is due to increased final weight, with the remaining one-third due to lighter placement weights.
Feedlot cattle achieve more total gain now than before due to increased days on feed. Figure 3 shows that average days on feed has increased significantly in recent years to a current average of 187 days, up by 39 days from 2010. More days on feed means that the resulting feedlot turnover rate has decreased from 2.46 in 2010 to 1.95 currently. This means that feedlots can now finish slightly less than two sets of steers per year, or in other words, feedlots can maintain feedlot capacity while producing less animals per year.
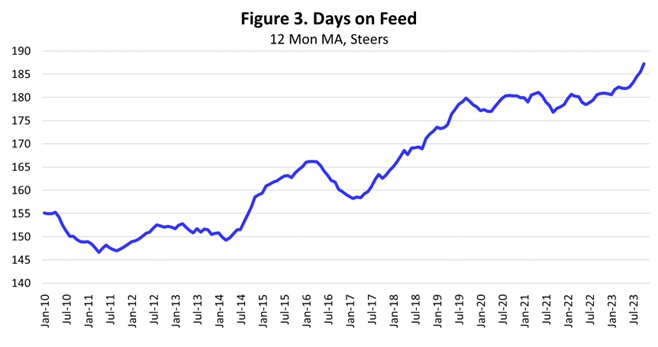
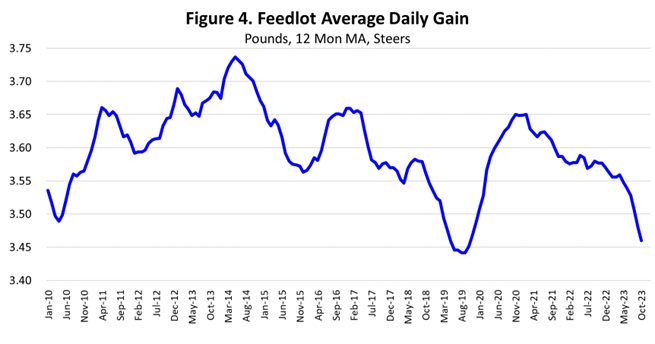
Figure 4 shows that average animal performance is quite variable over time. Average daily gain (ADG) is very seasonal and is impacted by weather, placement weight, feed markets, and cattle cycles, in addition to long-term trends. Feedlot ADG appears to have generally decreased since the peak in 2014. Most relevant to the current situation is the sharp drop in average daily gain in the past twelve months. Since late 2022, the twelve-month moving average of ADG has decreased by 3.4 percent to a current level of 3.46 pounds per day.
The feed/gain ratio, along with ADG, are the two most important economic indicators of feedlot profitability. Figure 5 shows that feed efficiency in feedlots has declined over time with the feed/gain ratio trending higher. Feedlot feed efficiency is impacted by the same list of short and long-term factors that affect ADG. The average feed/gain ratio has increased sharply in the past year with the current feed/gain ratio at 6.33, up 2.8 percent from one year ago.
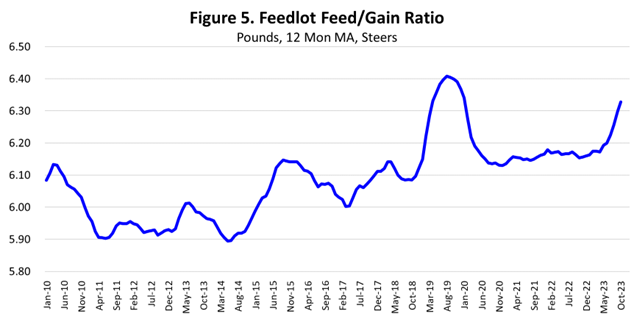
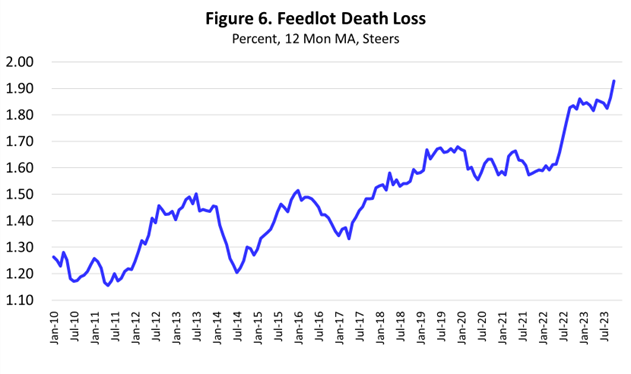
Figure 6 shows the concerning trend of higher feedlot death loss over time. The most recent twelve-month average steer death loss rate is 1.93 percent, up 56 percent from the 2010 level.
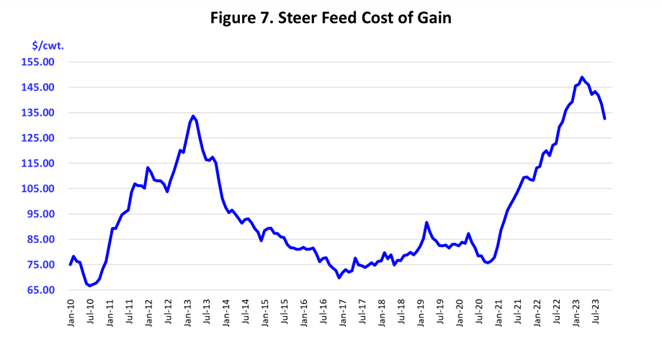
Feedlot productivity and management combine with underlying feed market conditions to determine feedlot cost of gain. Figure 7 shows the monthly feedlot steer cost of gain. After peaking at a record level of $149/cwt. in March 2023, cost of gain is declining with lower corn prices to the most recent October level of about $133/cwt.
Source: Oklahoma State University


